Depreciation can be the largest cost of owning a car, and it is the one you never see on an invoice. You pay it in a lump at the end, when you sell or part-exchange. Two cars at the same price today can be worth very different amounts in three years, and that gap is real money.
The Future Value & Depreciation report answers one question before you commit: what is this car forecast to be worth at a future date, at the mileage I expect to put on it? This guide explains what the report shows, where the forecast comes from, what it cannot tell you, and how to use it alongside the car’s value today.
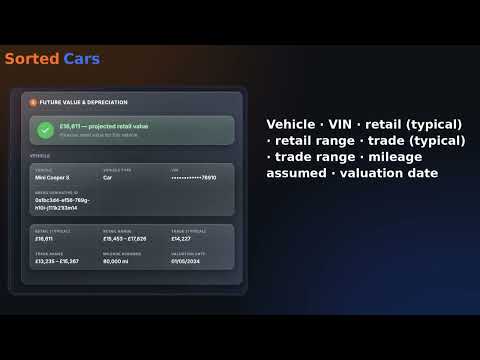
1. What the Future Value & Depreciation Report Is
It is a single paid report inside the SortedCars Paid Check builder. You enter the registration, tick the report, and it is built while you wait and shown on screen. It costs £2.99 on its own.
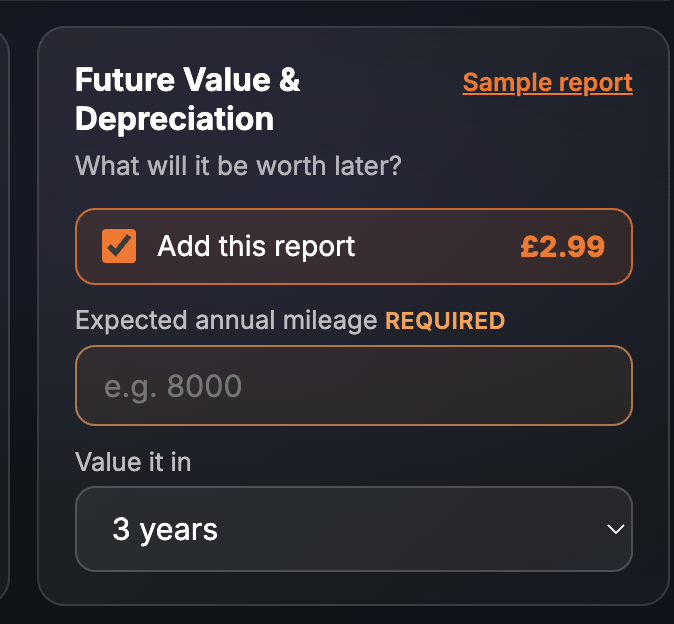
On the Paid Check page the card is titled Future Value & Depreciation with the strapline “What will it be worth later?”. It has two inputs. Expected annual mileage is required: the forecast assumes the car covers that distance each year. Value it in is a dropdown that sets how far ahead the forecast looks, default 3 years. So the forecast is for a point you choose, at the mileage you expect. The report’s coverage line reads “1 paid report + DVLA vehicle details” and its header carries a “NO DATA GUARANTEE” badge.
2. What the Report Shows
The finished report opens with the vehicle details from the DVLA — registration, make, model, colour, year and fuel — and then the Future Value & Depreciation section. Every screenshot below is sample data from our test environment: the registration is an official DVLA test number and the vehicle, VIN, values, mileage and date are fixed test records, not a real car and not a real forecast.
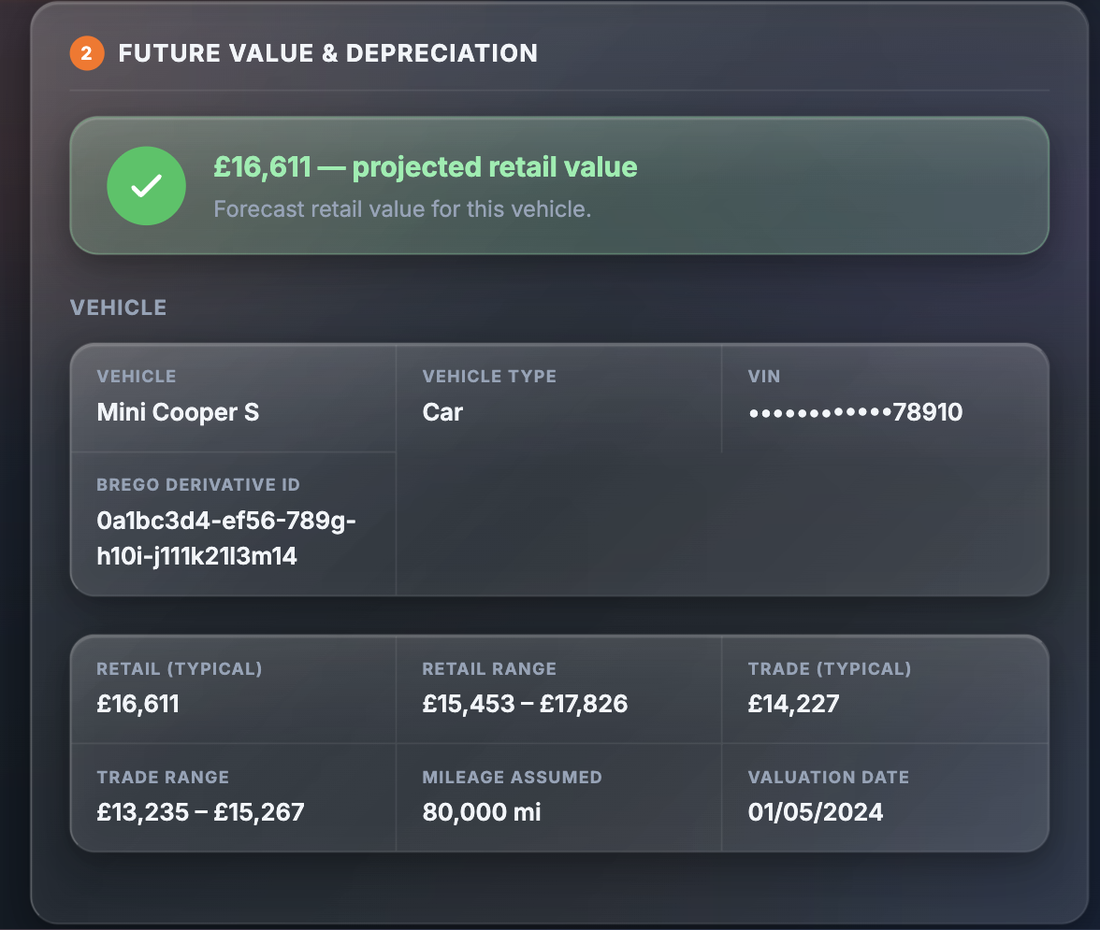
The section leads with a verdict — the projected retail value — and then two blocks. The first identifies what was valued:
| Field | What it tells you |
|---|---|
| Vehicle | The make and model the forecast was built for. Check it matches the car in front of you |
| Vehicle type | Car, van or other vehicle class |
| VIN (masked) | The chassis number with the leading characters hidden. Compare the visible tail with the car and the V5C |
| Brego derivative ID | The provider’s reference for the exact derivative — trim, engine and body — that was valued |
The second block is the forecast itself:
| Field | What it tells you |
|---|---|
| Retail (typical) | The forecast value if sold at retail — the kind of price a dealer would ask — at the valuation date |
| Retail range | The spread around the typical retail value, from a lower to a higher figure |
| Trade (typical) | The forecast value in the trade — the kind of price you would be offered in part-exchange or by a buyer who resells |
| Trade range | The spread around the typical trade value |
| Mileage assumed | The total mileage the forecast assumes the car will have reached at the valuation date, built from the annual figure you entered |
| Valuation date | The future date the forecast applies to, set by your “Value it in” choice |
3. Why It Matters
Depreciation sits alongside fuel, tax, insurance and servicing in the cost of ownership, and for a newer car it can be the largest line. Yet buyers guess at it, because the answer only arrives when the car is sold.
A forecast turns that guess into a number you can plan around. Take today’s price, subtract the forecast value at the date you expect to sell, and you have an estimate of the lost value over your ownership. Set that against the same sum for another car and the “cheaper” one may not be the one with the lower price today.
It matters particularly on finance. On a PCP the lender sets a minimum future value for the end of the agreement; whether you end up with equity towards the next car, or nothing, depends on what the car is worth against that figure. A forecast at your mileage suggests which side of that line you will land on. If the car is on PCP, read our Outstanding Finance Check guide too.
4. Where the Data Comes From
The forecast is provided by Brego. Brego identifies the exact derivative from the registration and VIN, then models a retail and a trade value for that derivative at the future date and total mileage you set. The vehicle details at the top of the report come from the DVLA, with MOT-related vehicle data from the DVSA. The report’s source line reads “DVLA · Brego”.
SortedCars does not hold or create valuations. We ask Brego for the forecast on the car at the moment you build the report and show you every value we receive.
5. What It Cannot Tell You
An honest forecast comes with honest limits.
- It is a forecast, not a quote or an offer. Nobody is bound to pay the figures shown. It is a modelled estimate of what a car like this is likely to be worth, and the ranges show the uncertainty around it.
- It is a single point, not a curve. The report gives a retail and a trade value at one future date and one assumed mileage. It does not draw the fall in value year by year. If you want another date, run it again with a different “Value it in” setting.
- It does not show today’s value. To see the expected drop you need the car’s value now as well, which is the separate Current Valuation report.
- It cannot see condition or history. The forecast is for the derivative at the assumed mileage. Damage, a poor service record or a write-off marker will move the real figure, and the model does not know about them.
- The market can move. Fuel prices, tax changes, new models and demand all shift used values in ways no model predicts with certainty. Longer horizons carry more uncertainty.
- The mileage you enter drives the result. Enter a mileage lower than you will really drive and the forecast will be too high.
Check a Car’s Full History
Check its history before you buy — free DVLA and MOT data in seconds.
6. What To Do With the Result
Step 1 — Check the vehicle block. The make, model, vehicle type and the visible tail of the VIN should match the car and its V5C. If not, the forecast is for a different car.
Step 2 — Pair it with the value today. Run the Current Valuation report on the same car. Today’s value minus the forecast value is your expected depreciation over the period you chose.
Step 3 — Work out a yearly cost. Divide the expected drop by the number of years and add it to fuel, tax, insurance and servicing. Compare that between cars, not the sticker price.
Step 4 — Use the trade figure for finance decisions. If the car is on a PCP or you plan to part-exchange, the trade value is the realistic one. Compare it with any final payment or settlement figure you have been given.
Step 5 — Re-run with honest mileage. If the number you entered was optimistic, rebuild the report. A forecast at the wrong mileage looks precise and is not.
If you dispute a finance company’s end-of-agreement valuation, complain to the lender first; the Financial Ombudsman Service is the free route after that.
7. Price and Where It Sits
| How to buy it | Price | What you get |
|---|---|---|
| Future Value & Depreciation report on its own | £2.99 | The forecast section plus the DVLA vehicle details shown above |
| Negotiator Pack | £4.99 | Future value alongside the reports that help you agree a price |
| PCP Buyer Pack | £4.99 | Future value with the finance check, current valuation and car tax — built for buyers taking over or paying off a PCP car |
| Complete Pack | £8.99 | Future value with the current valuation and the running-cost reports |
| Complete + EV Pack | £11.99 | Complete Pack with the electric-vehicle reports |
| Complete + History Pack | £14.99 | Complete Pack with the history reports |
| Premium Protected Pack | £24.99 | The full set of reports with protection included |
The Future Value & Depreciation report is not part of the Full Provenance Report. Prices are as shown on the site at the time of writing; the page price is always the price you pay.
Final Thoughts
Depreciation is the cost you feel last and pay most. For £2.99 the Future Value & Depreciation report gives you a modelled retail and trade value for the exact derivative, at a date you choose and the mileage you expect, with the ranges shown so you can see how firm the figure is.
Use it with the value today to see the expected drop, plan around the trade figure if finance or part-exchange is involved, and treat the result as a forecast from a model that has not seen the car. Then you know what the car is likely to cost you, not only what it costs to buy.
This guide provides general information and is not legal or financial advice. The Future Value & Depreciation forecast is provided by Brego at the time the report is built and is a modelled estimate of retail and trade value for the derivative at the future date and mileage you set; it is not a quote or an offer, it does not reflect the condition or history of the individual car, and the used-car market can move in ways no model predicts. Disputes with a finance company go to the lender first and then the Financial Ombudsman Service. SortedCars resells the data named above and has no other connection with the providers, garages or insurers mentioned.
Frequently Asked Questions
Check Any Car’s History for Free
MOT history, mileage analysis, and DVLA data — completely free with SortedCheck.