Every car you buy is a car you will one day sell. Two cars at the same price today can be very different propositions in three years: one will go in a fortnight at close to the asking price, the other will sit on the drive for months while you drop the price. Buyers rarely think about that on the day they buy, and it is one of the more expensive things to get wrong.
The Desirability & Demand report answers one question: how much does the market want this car, and how quickly do cars like it sell? This guide explains the two parts of the report, what each field means, where the scores come from, what a score cannot tell you, and how to use it whether you are buying or selling.

1. What the Desirability & Demand Report Is
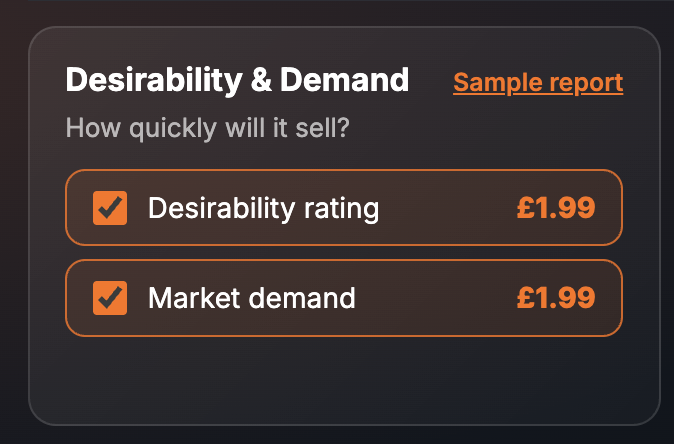
It is a paid report inside the SortedCars Paid Check builder. You enter the registration, tick the part you want, and the report is built while you wait and shown on screen. There are two parts, and you can buy either or both:
- Desirability rating — £1.99. A score out of 100 for the specific car, with the live advert statistics behind it: days to sell, adverts on sale, price and mileage ranges, and the colours currently advertised.
- Market demand — £1.99. A score out of 100 for the model against similar vehicles.
The card is headed “Desirability & Demand — How quickly will it sell?” on the Paid Check page. Tick both and the report contains both sections, one after the other.
2. What the Report Shows
The finished report opens with the vehicle details from the DVLA and DVSA, then the Desirability rating section, then the Market demand section. Every screenshot below is sample data from our test environment: the registration is an official DVLA test number and the scores, counts, prices and ranges are fixed test records, not a real car and not a real market.
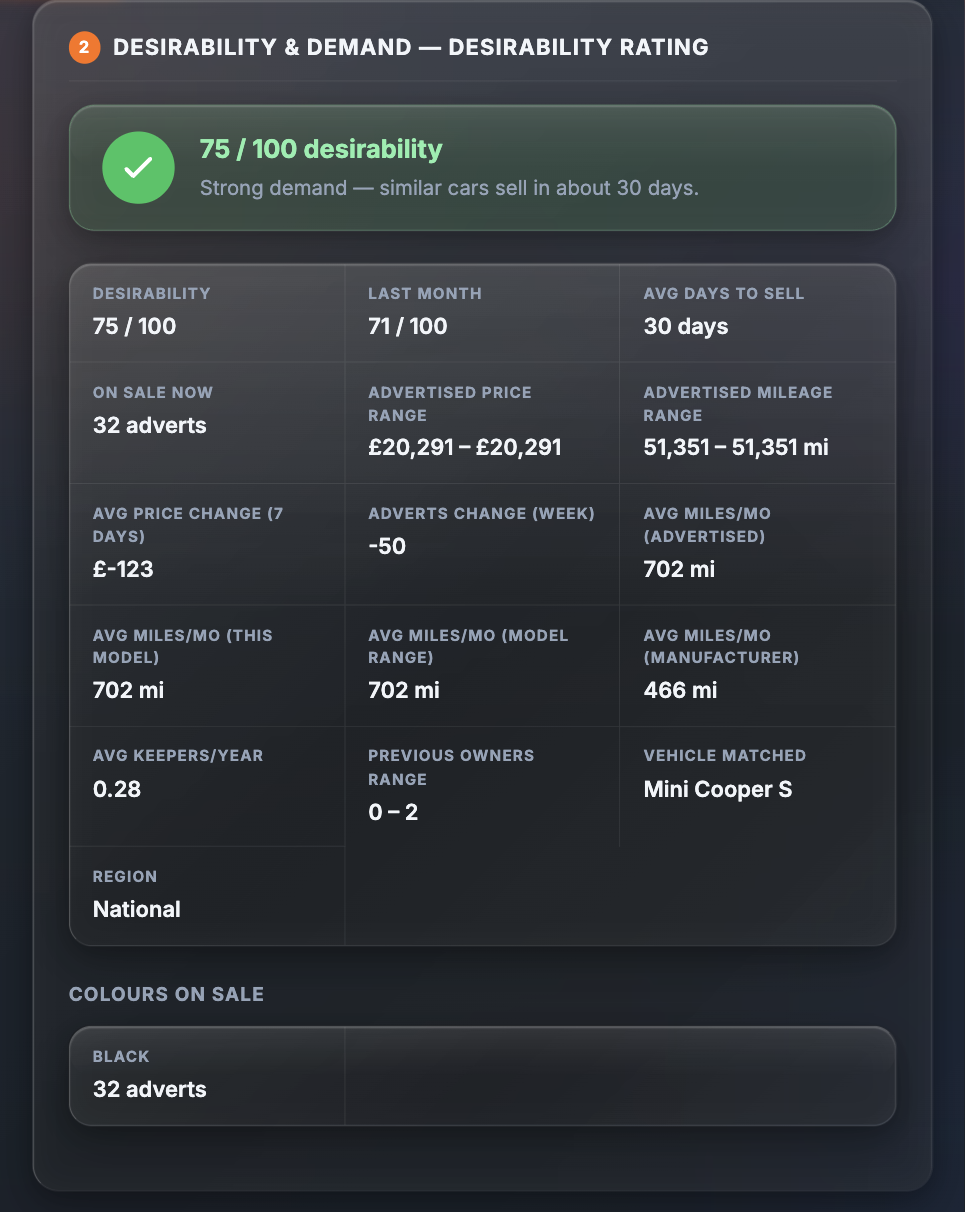
The Desirability rating section leads with a score out of 100 and a plain-English verdict, then the statistics behind it:
| Field | What it tells you |
|---|---|
| Desirability | The score out of 100 for this car |
| Last month | The score a month ago, so you can see which way it is moving |
| Avg days to sell | About how long similar cars take to sell |
| On sale now | How many similar cars are currently advertised |
| Advertised price range | The lowest to highest asking price among those adverts |
| Advertised mileage range | The lowest to highest mileage among those adverts |
| Avg price change (7 days) | How asking prices have moved over the last week |
| Adverts change (week) | Whether more or fewer of these cars came onto the market this week |
| Avg miles/mo (advertised) | Average monthly mileage of the cars advertised |
| Avg miles/mo (this model) | Average monthly mileage for this exact model |
| Avg miles/mo (model range) | The same figure for the wider model range |
| Avg miles/mo (manufacturer) | The same figure across the manufacturer |
| Avg keepers/year | How often cars like this change hands |
| Previous owners range | The spread of previous-owner counts among the adverts |
| Vehicle matched | The car the provider matched to the registration |
| Region | The area the advert statistics cover |
| Colours on sale | A list of colours currently advertised, with the number of adverts for each |
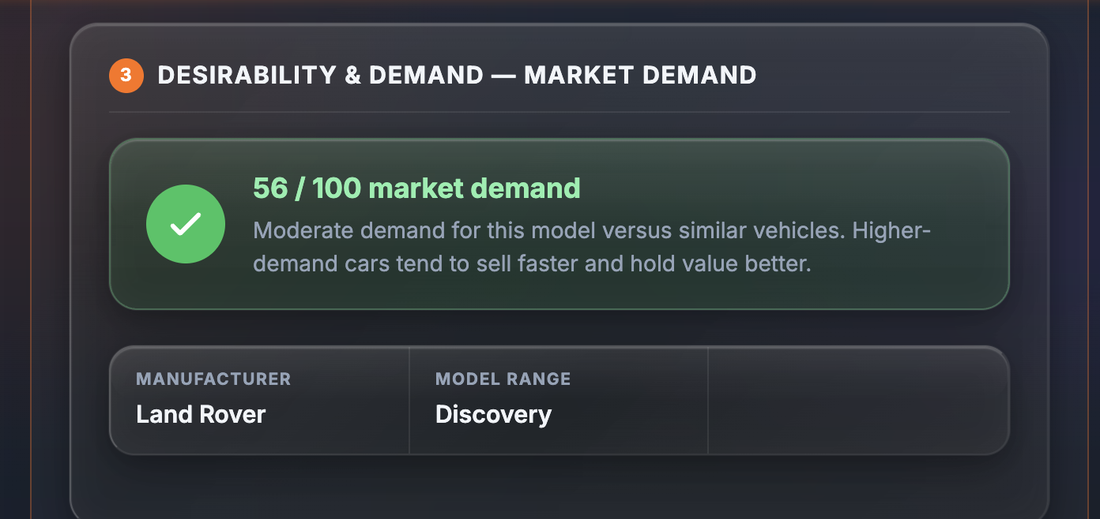
The Market demand section is shorter. It gives a score out of 100 for the model against similar vehicles, with a one-line verdict, and two fields:
| Field | What it tells you |
|---|---|
| Manufacturer | The make the demand score applies to |
| Model range | The model range the demand score applies to |
3. Why It Matters
For a buyer, demand is the difference between a car that is easy to move on and a car that is not. If your circumstances change — a new job, a growing family, a company car — you may need to sell sooner than planned. A car that similar buyers want will go quickly and close to its value. A car nobody is looking for will cost you time and money to shift.
Demand also tells you whether the asking price is reasonable. The Advertised price range and Advertised mileage range show you where this car sits among the ones actually on sale. An asking price above the top of the range, on a car with mileage near the bottom of it, needs a good explanation.
For a seller, the same figures answer the two questions that matter: what to ask, and how long to expect to wait. If similar cars take a month to sell, a fortnight without an enquiry is not a reason to panic-drop the price. If the adverts count is rising week on week, you are competing with more cars than you were, and pricing sharply early may save you a longer wait.
4. Where the Data Comes From
The Desirability rating section is provided by Brego, built from live adverts for cars matched to the registration. The Market demand section is provided by Percayso and scores the model against similar vehicles. The vehicle details at the top of the report come from the DVLA and DVSA.
SortedCars does not hold or create these scores. We ask the provider you chose for the data at the moment you build the report and show you every value we receive. Because the scores are built from live adverts, they move week to week, and the report shows the market as it stood when it was built.
5. What It Cannot Tell You
A score is a summary of the market, not a fact about your car.
- A score is not a valuation. A desirable car is not necessarily an expensive one and a high score does not tell you what to pay. For a figure, use the Current Valuation or the Price Predictor.
- It is not an offer or a promise of a sale. Average days to sell is what similar cars have done, not what yours will do.
- It moves. The statistics are drawn from live adverts and change week to week. A report from last month describes last month.
- It cannot see the car in front of you. Condition, service history and options are not part of the score.
- It is not a history check. Desirable cars get cloned, clocked and financed like any other. Run the checks in Car History as well.
Check a Car’s Full History
Check its history before you buy — free DVLA and MOT data in seconds.
6. What To Do With the Result
Step 1 — Place the asking price in the advertised range. Then place the car’s mileage in the mileage range. A price near the top of one range and a mileage near the top of the other is a car priced ambitiously.
Step 2 — Note the days to sell. If the seller has had the car advertised for longer than the average, you have a polite reason to expect some movement on price. If you are the seller, it tells you what a normal wait looks like.
Step 3 — Check the colour. The Colours on sale list shows what is on the market. A colour with very few adverts may be rare, or it may be unpopular; either way it is worth a thought if resale matters to you.
Step 4 — Use the two scores together. A car with a high desirability score in a model range with moderate market demand is a good example of an average model. A low car score in a high-demand range suggests something about this particular car — mileage, spec or price — is putting buyers off.
Whichever way you use it, the report is a negotiating aid rather than a substitute for checking the car. GOV.UK lists what to check when buying a vehicle, and if a purchase goes wrong Citizens Advice explains your rights. Our Buyer Tips cover the rest of the process.
7. Price and Where It Sits
| How to buy it | Price | What you get |
|---|---|---|
| Desirability rating on its own | £1.99 | The score, the advert statistics and the colours on sale, plus the DVLA vehicle details |
| Market demand on its own | £1.99 | The model demand score with manufacturer and model range, plus the DVLA vehicle details |
| Seller Pack | £2.99 | Includes Market demand |
| Negotiator Pack | £4.99 | Includes both Desirability rating and Market demand |
| Complete Pack and above | from £8.99 | Complete £8.99, Complete + EV £11.99, Complete + History £14.99 and Premium Protected £24.99 include the Desirability rating |
Prices are as shown on the site at the time of writing; the page price is always the price you pay. See all the Car Check Packs for what else each one contains.
Final Thoughts
Demand is the part of a car’s value that only shows up when you come to sell. For £1.99 a part, built while you wait, the Desirability & Demand report puts that information in front of you on the day you buy, when it can still change your decision.
Read the score with its direction, place the asking price and mileage in the advertised ranges, and note how long similar cars take to go. Then use a valuation for the number and a history check for the car.
This guide provides general information and is not legal or financial advice. The Desirability rating is provided by Brego and the Market demand score by Percayso; both are built from live advert data at the time the report is built, move week to week, and are neither valuations nor offers. Average days to sell describes similar cars, not a promise about any one car. SortedCars resells the data named above and has no other connection with the providers, dealers or sellers mentioned.
Frequently Asked Questions
Check Any Car’s History for Free
MOT history, mileage analysis, and DVLA data — completely free with SortedCheck.